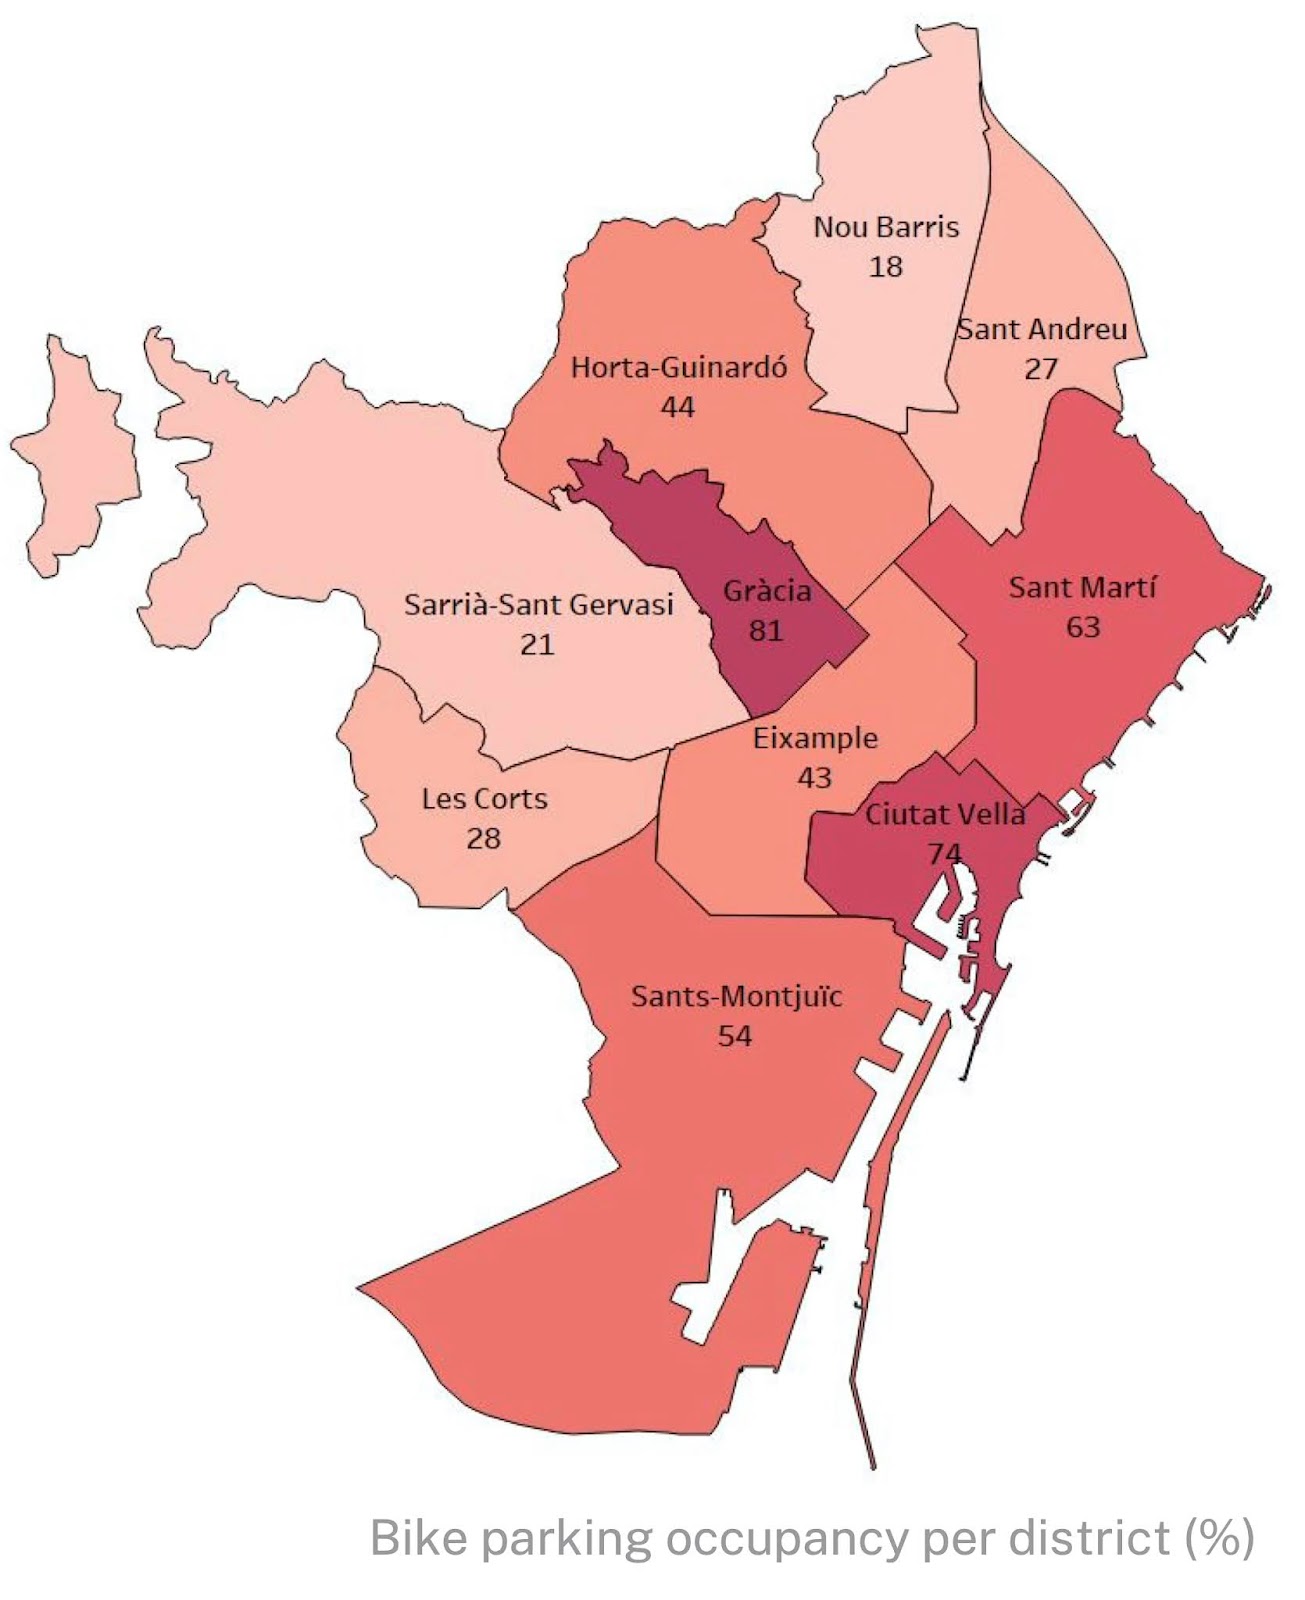
Urban on-street bike parking might have been an afterthought in the past, but increasingly cities will need better data on who, when and how residents are using on-street bike parking facilities. Which neighbourhoods are at capacity? Which areas need more facilities? What is the temporal dynamics and diurnal-noctural fluctuations? Where are the conflicts between pedestrians and illegally parked bicycles? Where are spots occupied by private bike-share programs? What about scooters? Or abandoned bikes? And what about kid bikes? How present are they in the urban cycling mix? And on average, how long do bikes stay in the on-street spots? Are they for day use? night use? or long term use? In this post I present some preliminary data with research conducted with Sofie Dejaegher, Esteve Corbera and Victoria Ortega, on urban on-street bike parking in Barcelona, with data collected between February and July 2021. Our journal article will come out later, but here are a few illustrative figures that start to tell the story of what we are seeing from our field data.
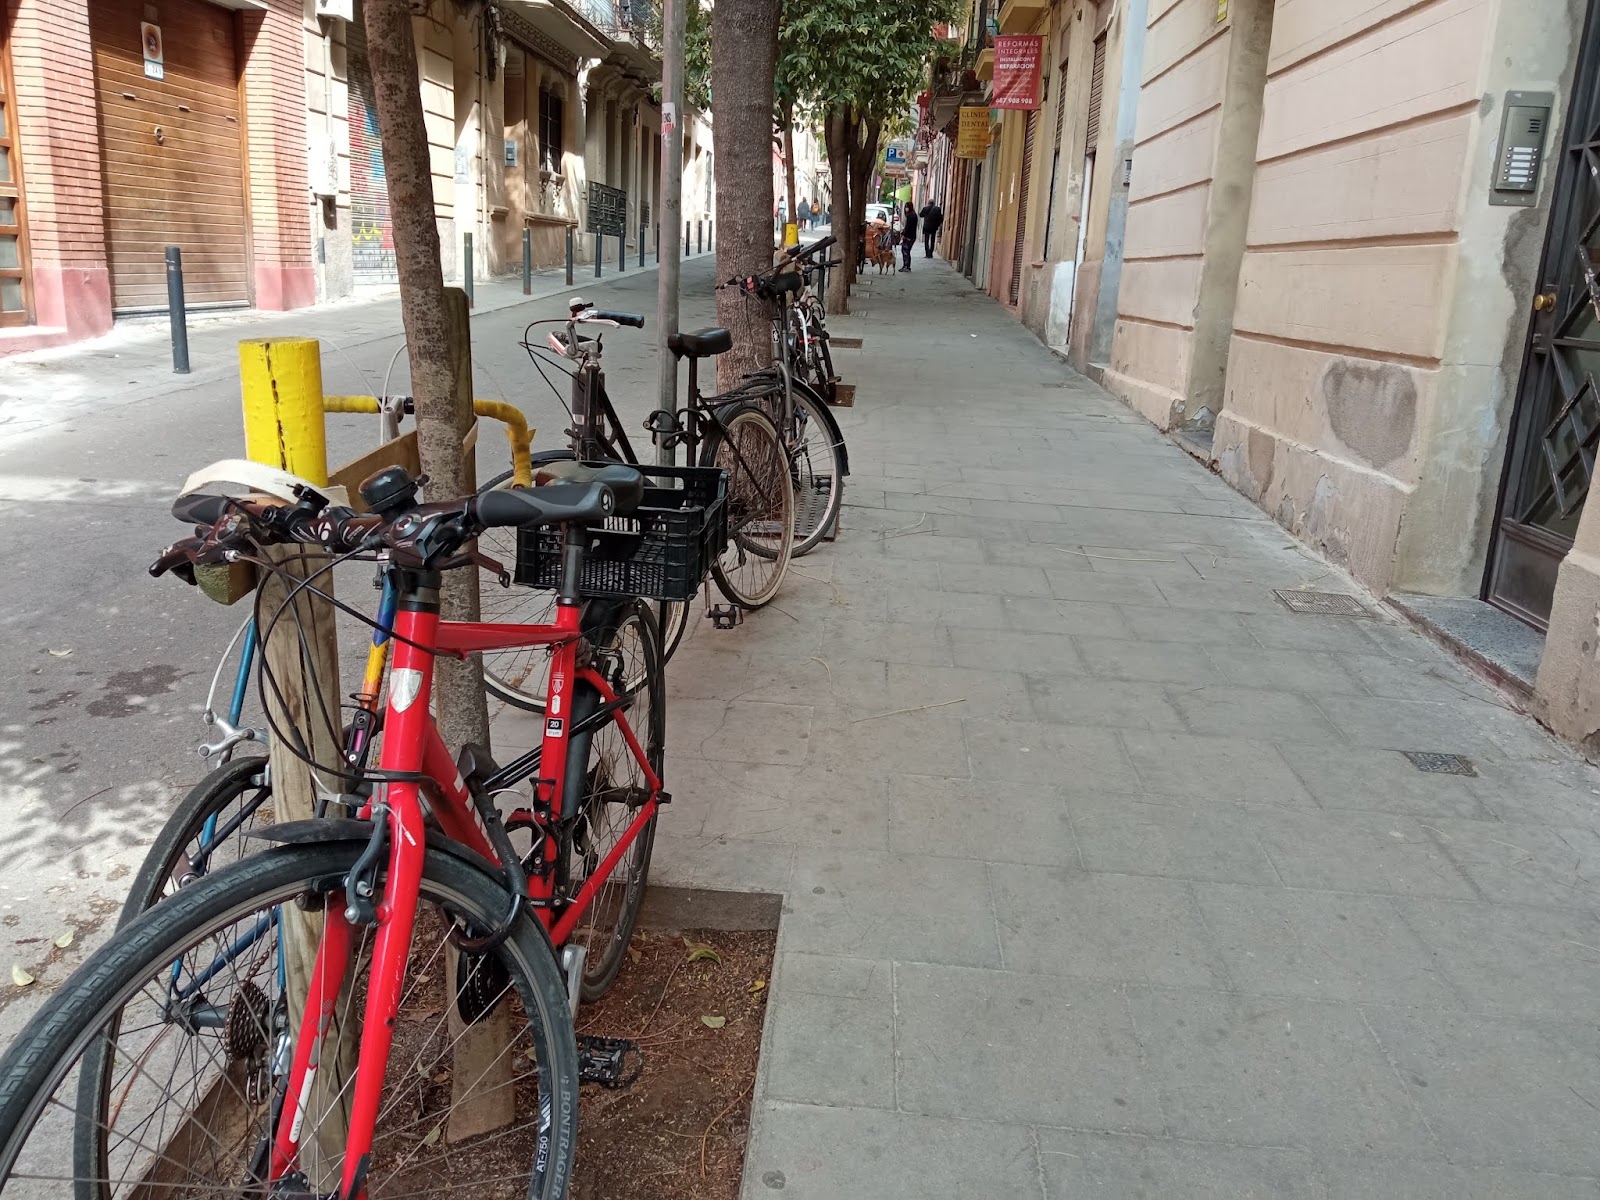
Informal or illegal bike parking in Gràcia (c/Joan Blanques). Gràcia showed the most number of illegally parked bikes and the highest occupancy rate of on-street bike parking.
Bike parking at 100% capacity in Plaça Rovira, Gràcia.
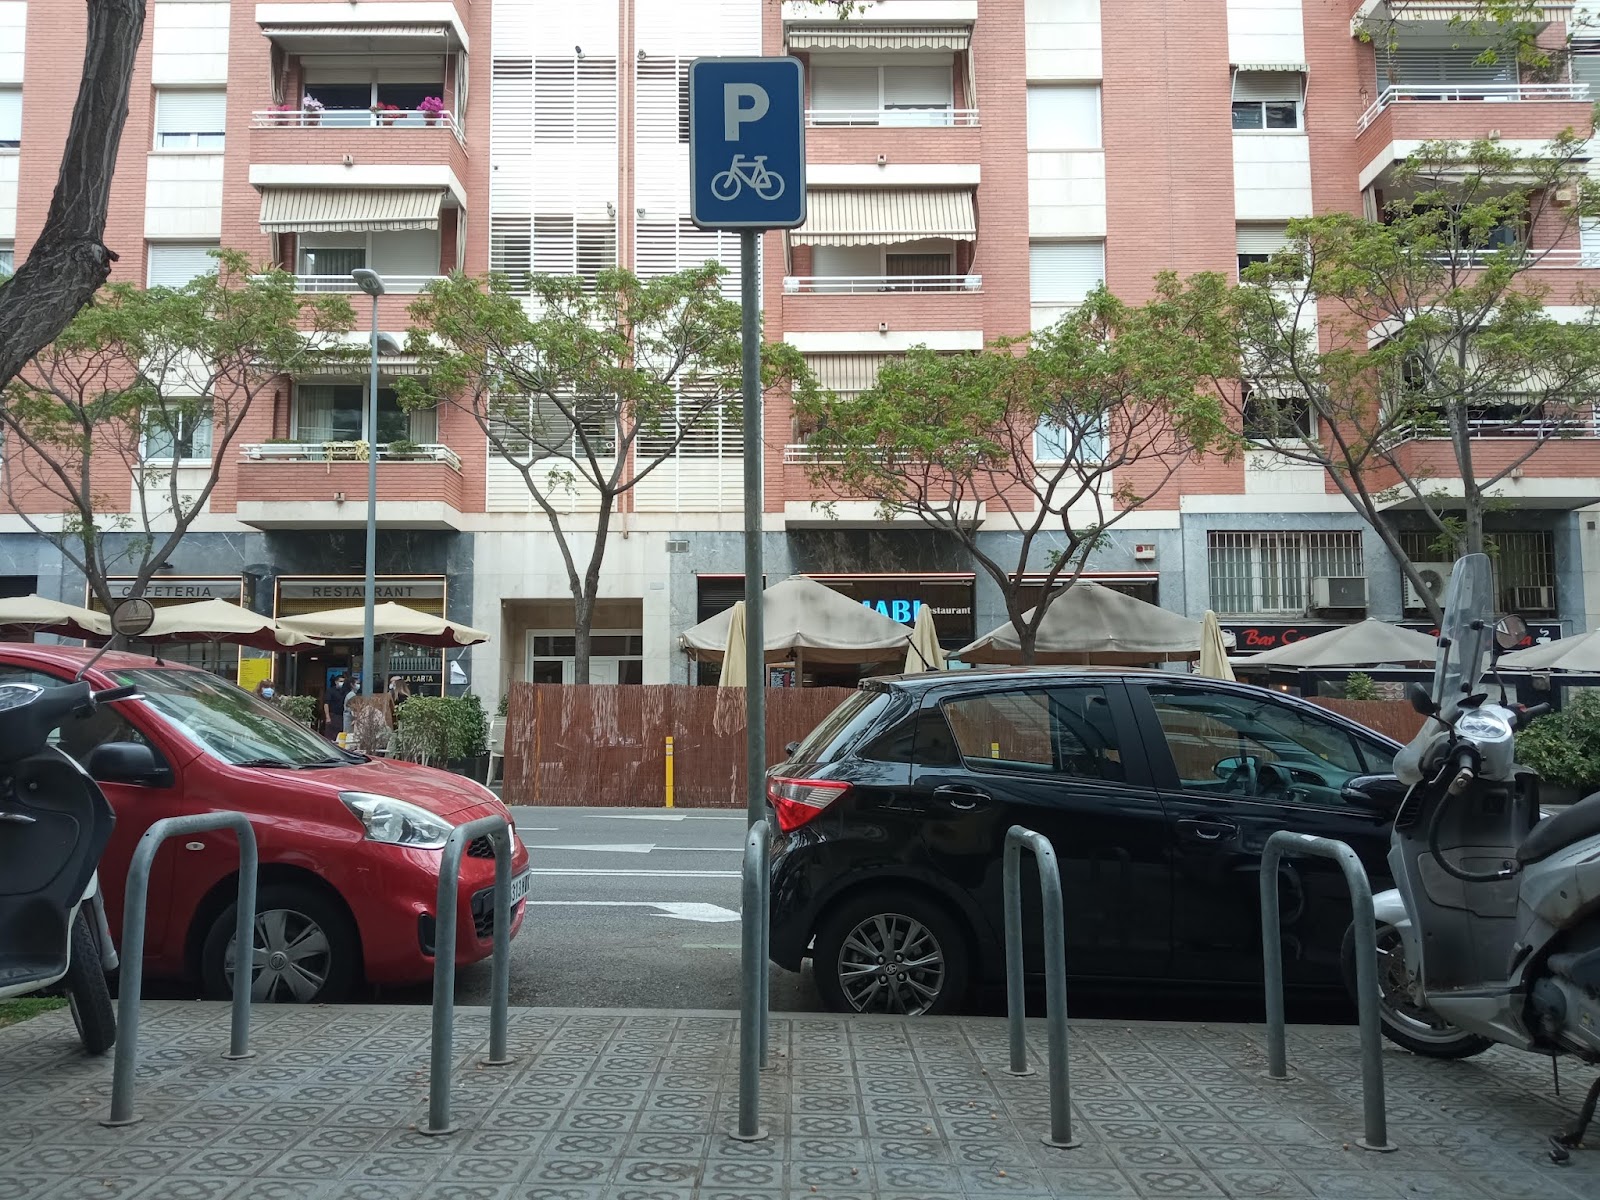
An empty bike parking location in Les Corts, accompanied by two guardian motorcycles.
Squeezing in bike parking in Gràcia, Barcelona.


